
Is my application dead?
How do system administrators know that applications are in "good" health?
The truth is that we usually don’t know until there’s an outage or a performance issue, by when it’s too late to prevent a downtime. Most physical load balancing appliances are like black boxes; we don’t have much visibility into what is going on with our applications. This means we don’t know there is a problem until it’s too late. Even then, we have no information on the root-cause of these performance issues.
What is "Application Health Score"?
While there are ways to monitor health score for every network element in our data centers, for this blog post’s purposes, let us focus on the definition and value of the “Application Health Score”. It is very important for application owners and system administrators to know the health of their applications. While application health may mean different things to different people, there are specific contributors that are more meaningful.
The problem is that a simple data point, say, the amount of available CPU, is not enough to determine if an application is healthy.
How does Avi calculate Application Health Score?

Load balancers are in the most strategic location in the path of application traffic. However, the architectural limitations (where control plane is fused with the data plane) of traditional appliance-based load balancers make it impossible for administrators to get application analytics. At Avi Networks, we built the Avi Vantage Platform, the elastic application services fabric on software-defined architectural principles. The separation of data plane from control plane enables the load balancers (data plane) to be deployed closest to the applications across any cloud infrastructure. The Avi Controller (control plane) that is situated off-path therefore has cycles to analyze the real-time telemetry captured from the distributed load balancers and provide analytics via an intuitive dashboard to the administrators.
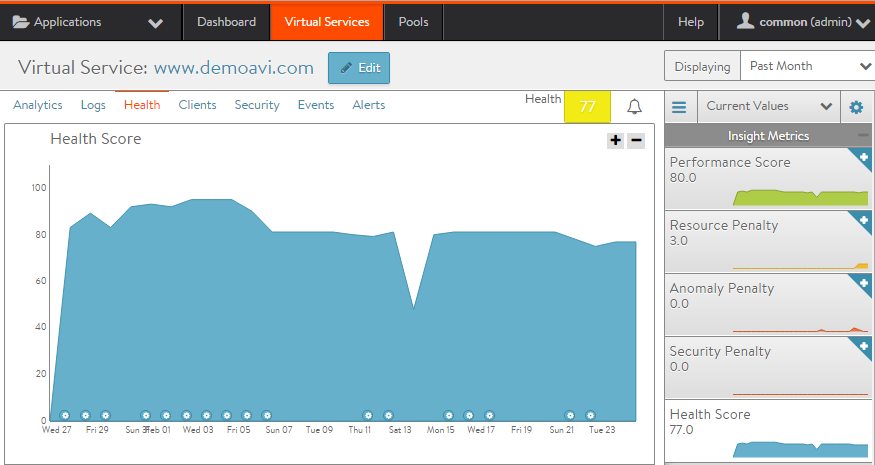
Using machine-learning algorithms, the Avi Controller processes real-time application telemetry to calculate the application health score. The following elements contribute to the overall health score of an application:
- Performance: Performance is comprised of end user's experience and server response
- Resource Penalty: A penalty is imposed if there are resource availability issues
- Anomaly Penalty: An anomaly (traffic that is outside the statistical norm) triggers anomaly penalty
- Security Penalty: This shows risks due to configuration settings that leave a site vulnerable, as well as vulnerability to attacks such as DDoS

In the Avi Vantage Platform, applications are color coded to indicate the health of an application:
|
Color code |
Health Score Range |
Application Status |
|
Green |
90-100 |
Healthy |
|
Yellow |
70-89 |
Identifiable issues |
|
Red |
<69 |
Issues that need immediate attention |
How Does This Simplify Operations?
Along with application health score, Avi Vantage records every transaction identifying the client information (device type, location, etc.), applications/sites being accessed, and a round-trip time with per-hop latency. This granular information not only reduces resolution time for network and app incidents but also enables MTTI (mean-time-to-innocence) for network administrators.
A “Network DVR”-like experience also enables administrators to go back in time (past hour, 6 hours, day, etc. all the way to the past year, or all-time) and view the historic performance of the application.
Are You in Good Health?
Visibility and analytics are critical for network and application admins in ensuring their applications do not become the Walking Dead. Check out this cool analytics demo!