
THAT DREADED TROUBLE TICKET:
You get a call Thursday morning from the owner of a high value application in a line of business within your company. The call goes something like this: “Our department’s application was performing very sluggishly yesterday afternoon. End users were complaining about slow page loads and transactions that timed out while waiting for the shopping cart to complete. I think something is wrong with the network infrastructure – please find the problem and fix it ASAP before today's busy hour. Oh, by the way the problem isn’t happening right now.” How would you troubleshoot an intermittent problem like this that happened the previous day?
THE BURDEN OF PROOF IS ON YOU:
The above is a scenario I heard about far too often among my past customers. The network is usually blamed, but the load balancer is usually the prime suspect. All critical traffic runs through it and it’s probably the least understood device along the traffic path. No one likes intermittent problems and I can tell you from firsthand experience that network vendors do not like troubleshooting these issues. In my past life, I often got calls from my customers requesting help dealing with these scenarios. I would rush down to the support department, get the customer on the phone, and tell them "when the problem occurs again, these are the things we need":
- A tcp dump on the client device
- A tcp dump from the upstream router
- A tcp dump from the front side of the load balancer
- A tcp dump from the back side of the load balancer
- Dumps from all the servers you’re load balancing to
NEED TO EXECUTE A WELL-TIMED DUMP:
If that isn’t difficult enough, you had to run these traces all at the SAME TIME in an effort to catch the problem transaction all the way through the system. As network engineers, we were trained to get to the ultimate truth on the network by collecting packet traces. Believe me, we hate asking customers for all this as much as you hate collecting such log data. We know it’s a ton of work and an almost impossible task given the unpredictable nature of such events. You’re not alone if you can’t complete this task. A majority of customers aren’t able to do this and the ticket just ages out with the vendor’s support engineers reaching out multiple times with no reply. We knew the whole thing stinks, but there was no better way. Wouldn’t it be nice if your Application Delivery Controller (ADC) had a “Tivo-like” capability built-in so you can quickly rewind and look back at all past transactions and find the potential problem in seconds?
ITS THE ARCHITECTURE MY DEAR WATSON:
It’s not that the leading ADC vendors don’t want to do this. It’s the fact that they need their load balancers to mainly do load balancing “tread mill run” that keeps them from solving this problem. Let me explain.
ADCs are logically composed of two halves, the Control Plane and the Data Plane. The Control Plane does housekeeping tasks like syslog, drawing the GUI/CLI, health checking, etc. The Data Plane does the heavy lifting of sitting in the data path and performing the actual connection by connection load balancing. From their inception, traditional hardware load balancers (such as F5 Networks) ran both Control and Data plane functions on every CPU. There is contention when load balanced traffic gets heavy and it starts to impact the control plane side of things; most evident in slower GUI draws and missed health checks. Later on, A10 Networks separated the two planes on to different cores. So on an 8 core A10 ADC, 7 cores would do the load balancing, while 1 core was dedicated to the management functions. This offered pretty good isolation until you’re load balancing across a huge set of servers, relegating all the health checking functions to that lone cpu core then becomes the bottleneck. You can’t solve this equation when Control and Data plane both sit on the same device. If you can separate and scale the two planes independently, then the classic conundrum can be solved.
THE BENIFITS OF SEPARATING CONTROL PLANE AND DATA PLANES:
One core innovation in Avi Vantage platform is the separation of these two planes. With such separation, the control plane gets all the processing power it needs, without being in competition for resources against the data plane. This allows some really nifty capabilities to be provided. Here are some examples:
- Show all transactions over the past year containing the URI /jsessionid=12345/
- Show all transactions over the past month with total render time > 700ms
- Filter transactions received from IOS devices
- See which IPs and countries these connections meet the above 3 filters
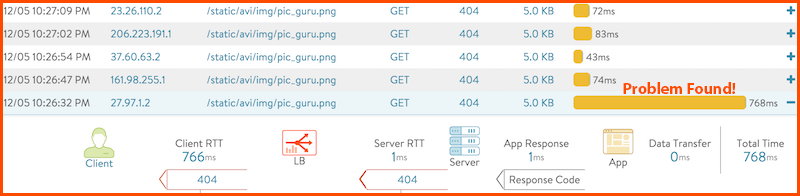
- Look into each and every one of these transactions and see, which server it was load balanced to, number of milliseconds it took from the client to the ADC, from the ADC to the server, the time it took for the server to render the page and respond to the ADC
With a powerful analytics engine like this available in the GUI, solving the above application roubleshooting challenge is not only doable, but would only take a fraction of the time versus collecting all the impossible tcp dumps. Inspecting yesterday’s traffic and performance data is as easy as watching last night’s Big Bang Theory on your DVR. If you want to take a look at how this works, join us for our weekly “demonar” on Tuesdays at 11:00 am PST.