
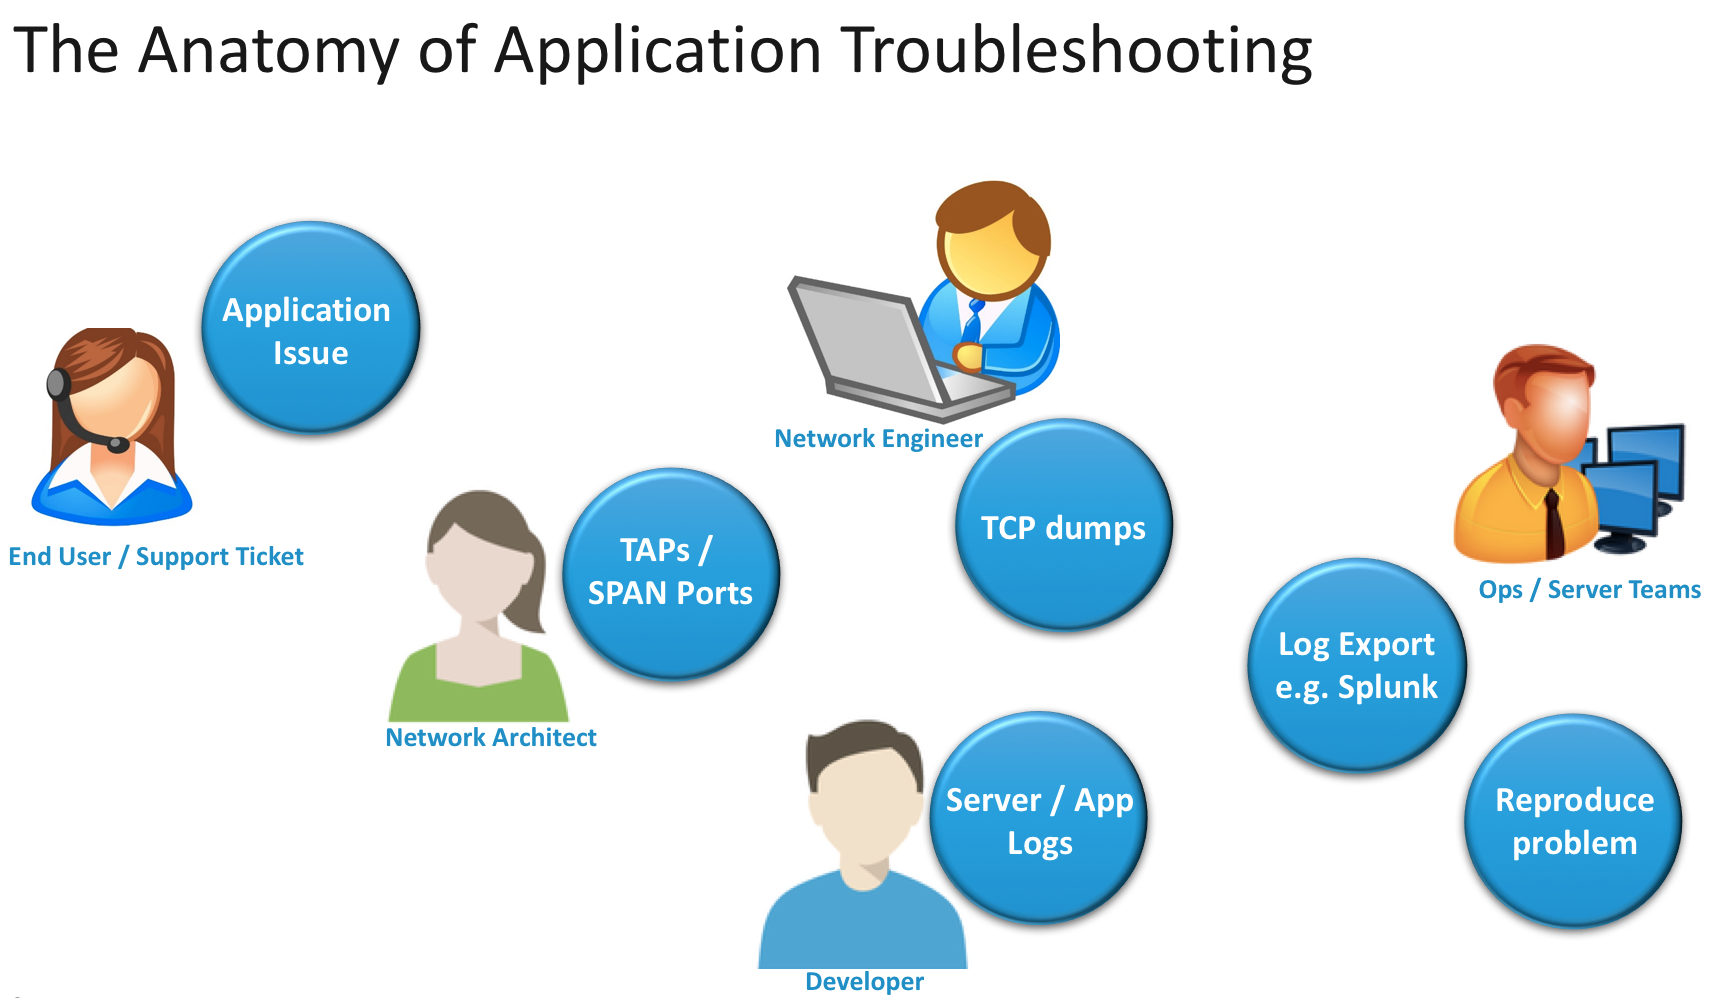
Imagine this scenario. It is a Wednesday morning and as the network administrator responsible for servicing business applications, you are processing a series of support tickets that arrived in the past few hours and the previous day. One of the high severity items on your plate this morning is from an application team that has been debugging poor performance of a business critical application. They have received complaints from end users and the line-of-business manager is concerned about potential revenue impacts. The application team has been frantically looking at their logs and haven’t quite pinned down the problem. They now believe it is an issue with the network and want your help finding the source of the problem. By the time the problem has been escalated to you it is already late and they want answers immediately. And just to add to the problem complexity, the issue has been happening sporadically for the last couple of weeks. What do you do?

For many network engineers this is a very real scenario and one that involves the use of a multitude of tools and systems to resolve. A typical course of action might involve poring through several TCP dumps taken at different points in the network, setting up test access points (TAPs) or the use of switch port analyzers (SPAN Ports) to analyze traffic data, or exporting log data to an external tool such as Splunk to identify potential correlations between traffic events and throughput.
The Load Balancer as a Source of Application Performance Data
Notice how most of the troubleshooting techniques above do not involve a critical component of your application services infrastructure – the load balancer. The load balancer occupies perhaps the most privileged position in your network (in line with applications), but it is under-leveraged as a source of real time application performance information. Why might this be? It comes down to the architecture. When Avi Networks sought to create a new L4 – L7 application services fabric, we fundamentally rethought the role of the load balancer. We saw the possibility that load balancers could play a much more expanded role in application networking services and created a distributed architecture built on software-defined principles. The Avi architecture uses a distributed data plane of high-performance software load balancers (that run on standard x86 hardware) orchestrated by a central controller. The load balancers send millions of continuous application data points in real time to the controller which analyzes the data creating a “Tivo-like” experience for reviewing application analytics.
![]()
Figure 1: Avi Vantage Platform: High-level Architecture
Troubleshooting Made Easy with Pinpoint Application Analytics
With Avi, an essential component of your network also becomes a critical application analysis tool. The Avi platform gives you a unique network-based perspective of application performance, security posture, and end-user experience.
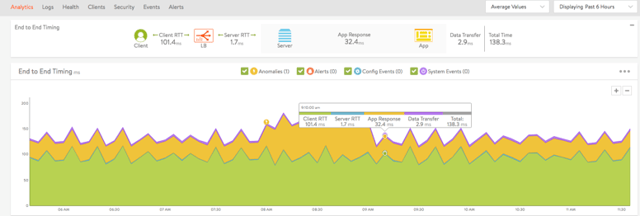
Figure 2: Avi Vantage Analytics Dashboard: End-to-end round trip time
Going back to our scenario, you could use Avi's end-to-end timing dashboard to identify that the overall application performance is healthy and the average WAN latency, data center network latency, and application processing times are within an acceptable range.
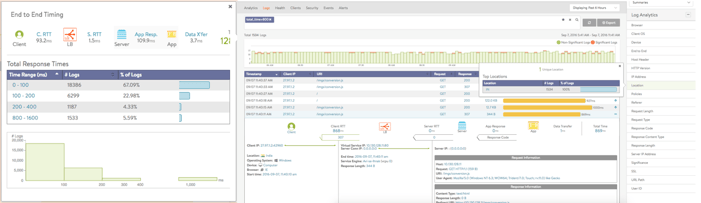 Figure 3: Avi Vantage Analytics Dashboard: Pinpoint Analytics
Next you would look at the detailed HTTP log analytics. You would look at the end to end latency histogram and identify that there is a small percentage of the users that are experiencing very high latency. After filtering the logs for high latency, you would run the 2nd order analytics to pinpoint the problem of high latency to transactions coming from India, and specifically, the WAN latency from India. All of this information is available at your fingertips and takes mere minutes to uncover.
Armed with this information, you can zero-in on application performance issues complementing the information from APM tools used by your application developers. The finger-pointing can end and all teams can work together to expedite troubleshooting. The system stores this analytics data for an extended period of time and enables viewing the information for specific times with drill-downs based on simple search queries.
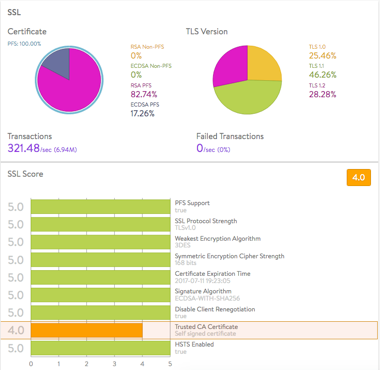
Figure 4: Avi Vantage Analytics: SSL Dashboard
If I piqued your curiosity enough, take a look at my recent webinar on this topic with a full demo of all the capabilities that I describe here. Send me a note to ashish@avinetworks.com and let me know if you have questions.