As Avi Networks set out to build the next generation of software load balancers, we wanted them to be optimized and smart. An important aspect that we considered was to use multiple analyses to understand and automate critical decisions that are usually manual, and often made without enough data.
Let us see why it is an interesting problem.
Insight into CPU or memory usage is not sufficient to understand the performance of a typical web application. A web application's SLAs are dependent on client experience, backend application performance, compute infrastructure, databases and storage, and the underlying network's performance.
Here are few examples of the relevant backend application performance metrics:
Concurrent Open Connections
Round-trip time (RTT)
Throughput
Errors
Response Latency
SSL Handshake Latency
Response Types, etc.
This list could include as many as a thousand different kinds of metrics when accounting for important data points from the entire infrastructure. Monitoring these metrics in real time (e.g. every 5 seconds) means monitoring 720,000 data points per hour. For a modest application with 10 backend servers, the number becomes 1.5 million metric samples per hour (assuming 150 metrics per backend server). This number grows to 1.5 billion metrics per hour for a modest mid-size enterprise data center with 1000 applications monitored over a million instances of metrics. The analytics team at Avi realized early on that this problem gets worse when you have tens of thousands of applications or a 100,000 microservices as the world moves towards container-based implementations.
Real-time Metrics Engine: Architecture
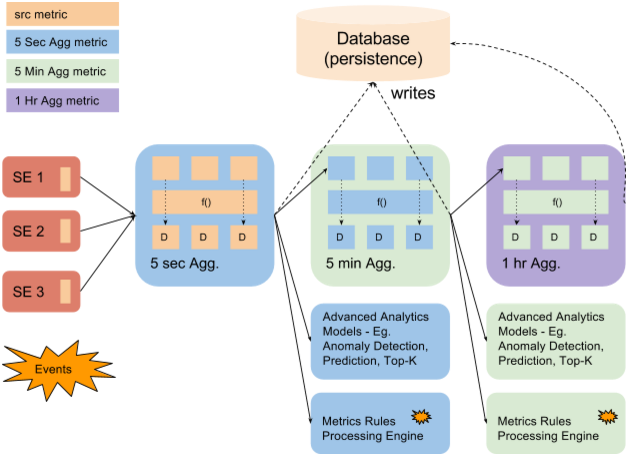
Real-time streaming metrics at scale is one of most challenging problems that we had to solve for compute, storage and I/O simultaneously to make it all work. This illustration represents functional metrics pipeline that can scale linearly with the number of applications in the data center.

Here are some of the challenges and how we solved them so that our customers would not have to do it themselves:
1. Scale of metrics collection and processing
If you think collecting metrics can quickly go out-of-control, just imagine how complicated processing these data points can become! Here are a few processing techniques that we used, to derive meaningful information from the billions of data points collected by Avi's distributed Service Engines:
Distributed Inline Collectors: As requests are load balanced by Avi's distributed Service Engines, they continuously collect metrics and relay it to the Avi Controller without incurring latencies of temporarily storing data in log files or agents. The metrics are measured accurately, at scale and pushed to one of the many analytics engines in the Avi Controller cluster in a timely fashion.
Stackable Metrics Processing Bricks: Each controller has a farm of loosely coupled and shared metrics processing units (aka, bricks). These bricks have a multi-stage in-memory pipeline to process each of these updates optimized to aggregate and transform metrics in a streaming fashion.
Batch Processing: As the distributed Avi Service Engines report metrics, they are looked up only once. The aggregations and derivations are done in a pipeline. This process eliminates the need to load them continuously to databases or in-memory caches. The operations are batched to reduce the system bus usage during metric aggregations.
2. Scale of disk storage - Metrics decay with time

"Real-time" in traditional enterprise software means data is no older than 5 minutes. For cloud infrastructure, where it is expected that service elasticity happens in seconds in response to the changing operating conditions, even 5 minutes is too long. Meaningful metrics require a granularity of at least 5 seconds if analytics-driven actions need to be performed in seconds. 5-second metric collection is a 60x improvement when compared to what is considered the gold standard in cloud computing. On the flip side, we are now writing more than 250GB a day with the simple assumption that each metric is a 4-byte number. Before you can comp up with efficient encoding techniques, it is not a winnable war when one adds up the cost to archive, backup, etc.
Not so long ago, I had just wrapped up an Avi analytics demo at a Fortune 500 company. One of the gentlemen walked up to me and talked about how their team is doing mining of metrics and big data around it. I asked him how he was dealing with storage, and he smiled and said: "I have to figure it out; within a few months of the project I am sitting on terabytes of data and don't know what to do with it!"
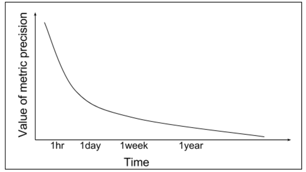
We delved a bit more into this problem. While we believe that high precision data is extremely useful to make real-time decisions, its value degrades exponentially as the time progresses. For example, nobody cares about 5-second granular data from more than one year ago. But, what *is* valuable are the insights from the data, that you can glean and preserve rather than just the raw data. We made a practical choice to compress the data as its usefulness decays.
| Time of measurement | Granularity of Metrics | Data Compression |
| 1day | 5min | 60X |
| 1week | 1hr | 720X |
| 1year | 1day | 17,280X |
3. Scale of I/O writes
The next challenge we ran into was the range of I/O. A simple approach to putting data in a relational database like MySQL or Hadoop-based big data store did not scale for workloads with a high amount of writes and complex reads at the same time. None of the existing open source databases like MariaDb, PostgresSQL, MySQL, etc. had native ability to handle the use case of high TPS writes. A time series optimized database like influx DB did not exist. A closer analysis led to finding the cause of poor performance - interleaving of read, writes and deletions when data compression happens.
Instead of creating a new database altogether, we changed the workload behavior to use databases in an append mode and be intelligent about when to delete or modify. This gave us significant jump in the performance with existing databases and did not require a new database engine!
4. Threshold Crossing Events
As we worked on the problem, some of our customers expressed a desire to signal events when a metric went above a threshold. A simple static threshold checking is a complex problem when done at a scale of monitoring a billion metrics an hour. Adding support for this logic to be in line with the metrics pipeline seemed to be a natural and efficient solution as metrics did not have to be read from database or disk (Hadoop) for event triggers. With a very minimal in-memory cost we also added support to generate events based on metrics hitting a high watermark for the first time since the low watermark level.
5. Basic vs. Derived Metrics

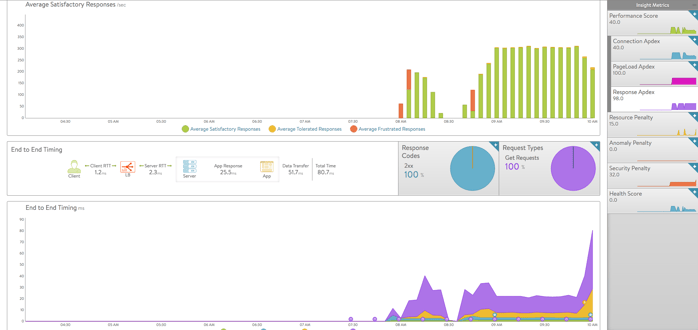
Often, the more interesting performance metric is created by combining multiple metrics into one. We added support to perform simple transformations on measurements like averages, maximums of values, sum of all reported values, etc. However, we found that knowing the percent of responses that had errors was quite an interesting metric. The question then was whether to ask our metrics collectors, Avi Service Engines, to capture this metric or just compute it from other two metrics that were already being reported - the number of requests served, the number of 4xx and 5xx errors. Performing such transformations in Avi Service Engine would have increased both compute and data transfer load on the Service Engines. Instead, we found that the ability to transform and combine metrics from multiple sources in the Avi Controller was incredibly powerful and allowed us to create many metrics such as average end-to-end timings. These widgets were ultimately used to adorn the dashboard pages with a rich pallette of useful data at a glance.
6. Complex metrics - Quantile and Top-K

As it turns out, admins of e-commerce and internet companies are more interested to know the 90th percentile of response times to their users more so than the average page load times since those users have a bigger impact on business than those who get the best service (lower latencies). A somewhat naive approach to computing 90th percentile metrics would require the Avi Controller to store all the historical metric values. Instead, we took inspiration from The P2 algorithm for dynamic calculation of quantiles and … by Jain et al. to compute the percentiles. It is O(1) in computation and requires small constant in-memory storage. For a single application with a thousand metrics the space used by this approach is 80KB vs. 138MB.
Similarly, we added support to learn incrementally - Top-K URLs, clients, devices, etc. as metrics are processed in the pipeline. Like the percentile metrics, we didn’t want the in-memory state to grow to compute Top-K elements. We took inspiration from Efficient Computation of Frequent and Top-k Elements in Data Streams by Metwally et al. to implement Top-K metrics which uses approximately one thousand counters to find the top 100 from a million different options.
Ernest Dimnet, the French author of "The Art of Thinking" once said, "Too often we forget that genius, too, depends upon the data within its reach, that even Archimedes could not have devised Edison’s inventions." Similarly, we strive to bring forward the most insightful data to the finger tips of network administrators and application owners. So, whether it is troubleshooting application performance, enforcing the right security, or making business decisions based on end user access patterns, let data drive your decisions - we have done the thinking to make that possible.


